xViz
ProductPricingCommunity
  • Welcome to xViz Docs!
  • Project Management
    • Project Management - xViz Gantt Chart | Introduction
    • Hierarchy and Additional Columns
    • 🔸Milestones
      • Milestone Formatting
    • Planned Bars
      • Planned Bars Formatting
    • Connectors
      • Primary & Secondary Connectors
      • Multiple Connectors
      • Connectors Formatting
    • Progress
      • Tracking the progress
      • Progress Bar Display
      • Progress Base
      • Bar Formatting
    • Timeline Configurations
      • Timeline Start/End
      • Timeline Range
      • Header Levels
      • Zoom Levels
      • Zoom Options
      • Fiscal Year Support
      • Timeline Format
      • Language Support for Timeline
    • ✨Alerting Techniques
      • Steps to enable Conditional Formatting
      • Conditional Formatting
    • Reference Lines and Reference Range
      • Introduction
      • Static Approach
      • Data Driven Approach
    • Resource Gantt
    • ➡️Other Features
      • Data Colors
        • Row Background Color
        • Bar Border Color
        • Bar Selection Color
        • Bar Fill Color
        • Connectors
      • Duration Data field
      • Display Duration
      • Display Totals
      • Hide Blanks
      • Date Formats
      • DaysOff
        • Weekday
        • Custom Date
      • Setting Up Drill-through
      • Configure External URLs
      • Splitter Position
      • Text Customization
      • Row Numbering
      • Indentation
      • Sorting
    • Parent Level Calculations
      • Aggregation Types
    • Tooltip
    • Release Notes
    • ❓FAQs
  • Performance Management
    • Performance Flow - Introduction
      • Installing from AppSource
      • Get Started
    • Use Cases
      • Organization Performance
      • Microsoft Tenant Data Analytics
        • Organization Chart using Microsoft Graph API
      • Process Flow
      • Sales Performance Analysis
      • Cost Center Analysis
      • KPI Tree
      • Warehouse Management
      • Supply Chain Network
    • Configuring the chart structure
      • Hierarchy structure
      • Grouping / Swim Lanes
        • Data Structure for Columnar Group View
        • Data Structure for Wide Group Views
      • Invisible Group
    • 🪪Display Data in the Cards
      • Title, Subtitle
      • 👨‍💼Images
        • Converting HTTPs link images/icons to Base 64 in Power BI
        • Handling long Base 64 URLs in Power BI
      • 🔢Displaying KPIs
        • Number Formatting
      • 🔻Displaying Variance
      • Sparkline Trends
      • 🔗Hyperlinks
    • Card Formatting
      • Data-Driven Color
      • Templates
      • Customize Template
        • Insert additional data
        • Alignment
        • Wrap Text
        • Styling
        • Margin & Split
        • Modify (Delete / Cope-Paste)
        • Import/Export
    • Links
    • 🗒️Notes & Annotation
    • 🚦Conditional Formatting
    • Layout & Orientation
    • ✨Search
    • ✨Viewing Subtrees
      • Cross Filtering with Subtrees
    • 🔐✨User Context - RLS Experience
    • ✨Filter Context
    • 🎨Formatting Features
      • Formatting Font & Colors
      • Connectors
      • Expand Collapse Button
      • Dimensions
    • Toolbar Ribbon Configuration
    • Simulation
    • ❓FAQs
      • Circular Dependency message
    • Tips & Tricks
      • Bookmark
      • Report Page Tooltip
      • Field Parameters
      • Drill Through
    • Release Notes
Powered by GitBook
On this page
  • Full/Minimized Views
  • Allowed User Control

Was this helpful?

  1. Performance Management

Toolbar Ribbon Configuration

PreviousDimensionsNextSimulation

Last updated 6 months ago

Was this helpful?

The Toolbar Ribbon in xViz Performance Flow provides extensive options for configuring and formatting the visual.

You can configure which options are available to report end users/viewers in the Power BI Service. Using the available options, the report viewers can easily interact with the visual and generate insights as per their preference. The Toolbar Ribbon can also minimize to increase the plot space.

Let's take a look at how we can configure the toolbar ribbon:

After clicking the downward arrow on the bottom right of the menu, the visual provides the following three options to configure the toolbar ribbon:

Full/Minimized Views

Selecting the "Full" option displays the toolbar in an expanded state, showing all icons and their descriptions as shown image below:

Selecting the "Minimal" option displays the toolbar in a collapsed state, showing only the icons without descriptions, as shown in the image below:

Allowed User Control

Allowed User Control allows developers to control access to toolbar options in the read view of the Power BI Service for report end users. After selecting the "Allowed User Control" option, a dialog box will appear in the visual, as shown below:

For example: In the "Allowed User Control" dialog box, only the "Design" and "KPI/Variance" options are selected as shown image below:

As a result, these are the only options that will be visible in the visual in Power BI Service for report end users, as shown in the image below:

Full/Minimized
Allowed User Control
GIF 1: Toolbar Ribbon Configurations - Full/Minimized View and set up for Read View
Image 1: Toolbar ribbon Configuration options
Image 2: Full view
Image 3: Minimized view
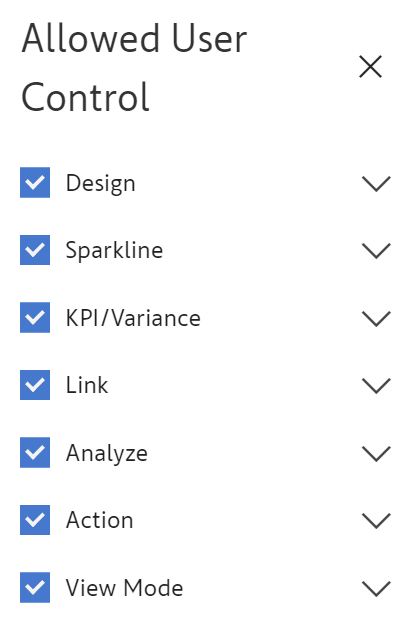
Image 4: Allowed User Control
Image 5: Select options
Image 6: Selected options visible in service for report end users